
What you can measure our work by

Anonymized projects from automotive, manufacturing, construction and finance.

Industry
Service

Automotive & suppliers

AI-supported workflowsAgentic S&OP

Agentic S&OP: an AI workflow delivers recommendations ready for decision.

Automotive supplier, international · sales and operations planning (S&OP)

Starting point

Call-offs change faster than the monthly planning cycle

  • Late reaction: Call-off cuts, requests and lead-time jumps assessed only in the monthly cycle
  • Fragmented data: Data spread across separate systems, analysis takes heavy manual effort

Solution

Orchestrated AI agents detect, assess and recommend, people decide

  • Detect: A signal agent checks new call-offs and customer emails on its own
  • Assess: Agents quantify the impact in euros and units, every figure calculated from the planning data
  • Decide: The best mix of actions as a proposal, approved by the planner with a log
  • AI agents
  • Process automation
  • Forecasts and scenarios
  • Data integration

Result

Counter weeks earlier, load production evenly, avoid emergency measures

  • Utilization: Peaks smoothed, free capacity reallocated instead of extra shifts
  • Costs: Fewer special freights, excess stock reduced early instead of written off
  • Delivery performance: On-time delivery secured, customer requests confirmed only with feasible volumes

Qualitative result

Weeks earlier

countermeasures instead of waiting for the monthly planning cycle

Automotive supplier · sales and operations planning
Industry & manufacturing

Data-driven decisionsFinancial Steering

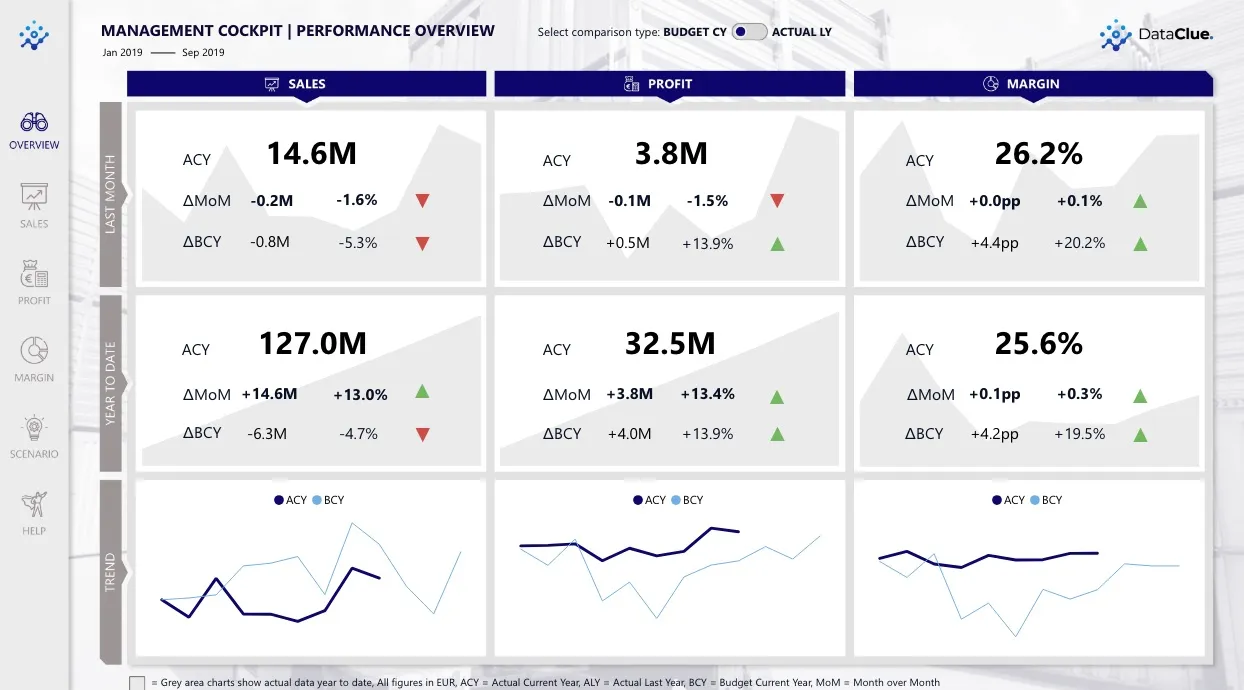
Full margin transparency across three sites and multiple ERP systems

Starting point
Three production sites operated on different ERP systems with no integrated view. Monthly reporting relied on manual Excel consolidation.

Realized

50%

less monthly consolidation effort

3 sites · multiple ERP systems

  • Zero manual consolidation errors
  • Full margin transparency by client and product
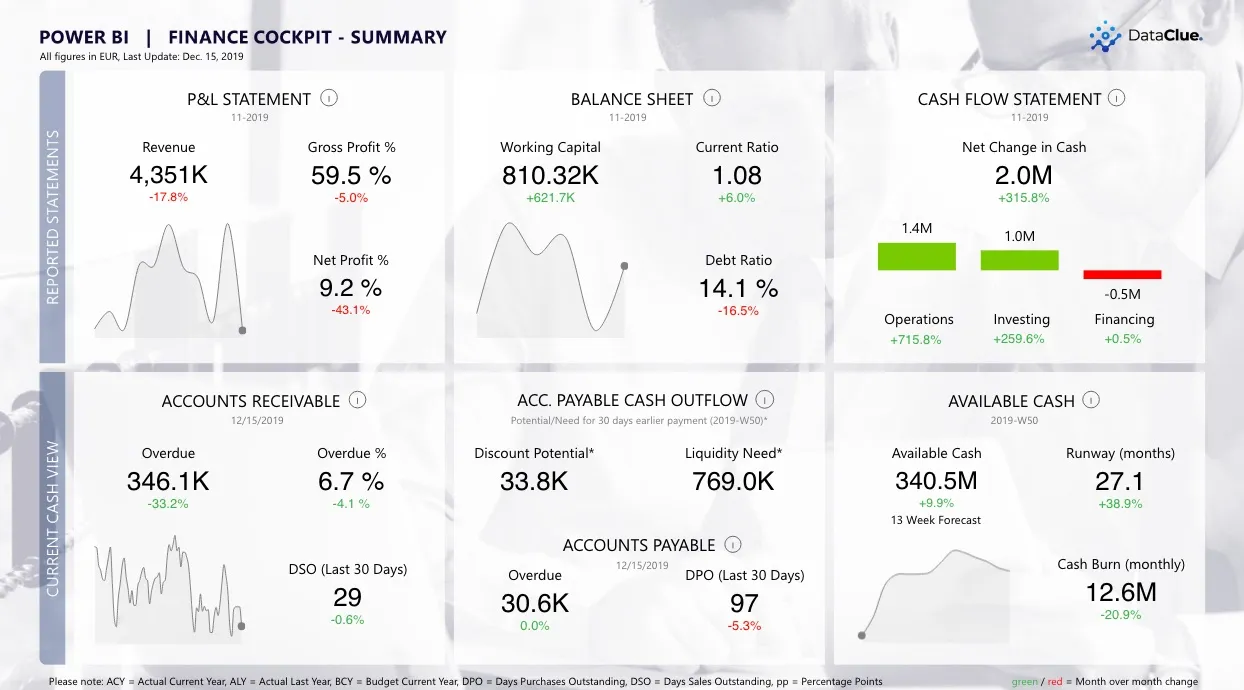
Preview of the interactive report: Full margin transparency across three sites and multiple ERP systems

Interactive Power BI report Values for illustration

Open the report in full size

Data-driven decisionsOperational Performance

Data-driven continuous improvement: technical availability raised from 70% to 88%

Automotive supplier (tier 1) · stabilizing the ramp-up

Starting point

Ramp-up under pressure, causes of loss unknown

  • Delivery at risk: Output below customer demand, backlogs growing
  • No reliable picture: Downtime and scrap spread across paper, spreadsheets and separate systems

Solution

Losses made visible per station and eliminated systematically with lean routines

  • Data foundation: Existing systems connected, a daily cockpit of overall equipment effectiveness (OEE) and losses per station
  • Analytics: Biggest OEE loss drivers identified in each work cycle, actions derived from the data
  • Steering: Implemented with the line team, the impact of every action measured
  • Data integration
  • KPI systems and dashboards
  • Impact measurement
  • Change management

Result

Ramp-up stabilized, more output from the same line

  • Technical availability: +18 percentage points (from 70% to 88%), the biggest OEE lever
  • Scrap: Cut from 12% to 7%
  • Output: +85% a little over a year after start of production

Realized

+18

percentage points more technical availability, the biggest OEE lever

Component of overall equipment effectiveness (OEE)

Taskforce & expert deploymentRamp-up taskforce

Ramp-up taskforce: weekly output in a new-product launch increased more than tenfold

Industrial supplier, operating internationally · industrialization of a new product at several sites

Starting point

Ramp-up in crisis, start of production at risk

  • Risks spotted too late: Schedule and start of production at risk at several sites
  • Line overloaded: Problems solved alongside daily business, resources spread without focus

Solution

Taskforce started at short notice, bottlenecks worked off in fixed cycles

  • Start: Core team free of line duties, in tandem with the line managers
  • Steering: Short work cycles, a weekly steering committee, actions measured against KPIs
  • Handover: De-escalation criteria defined in advance, open topics handed to the line
  • Taskforce lead
  • Situation diagnosis and de-escalation
  • Risk and decision management
  • Training and enablement

Result

Start of production secured, the line carries on by itself

  • Good-part rate: Raised from about 30% to above 80%
  • Bottleneck cycle time: Cut by more than 40%
  • Embedded in the line: Routines and KPIs taken over by the line team

Realized

Above 80%

good-part rate, from about 30% when the taskforce started

Industrial supplier · new product industrialization · several sites

Rounded values.

Data-driven decisionsLaunch Readiness

Program cockpit: the status of all ramp-up programs and sites in one view

Industrial company, international site network · steering of ramp-up programs

Starting point

Many programs, many sites, no shared picture

  • Scattered data: Sites report their status in separate spreadsheets, each in its own format
  • Manual consolidation: Status picture merged by hand every week, deviations spotted late

Solution

One reporting logic, one data model, one executive cockpit

  • Capture: A standard template with upload and automatic checks per site
  • Data model: Programs, sites and reporting dates in one model, history through stored snapshots
  • Cockpit: KPIs per program and site, deviations at a glance
  • Data integration
  • KPI systems and dashboards
  • Data quality and governance
  • Program planning and steering

Result

One picture for all programs, deviations visible early

  • Transparency: 12 KPIs in one cockpit for the entire site network
  • Rollout: Started with about 20 programs, more sites to follow
  • Effort: 20 hours of manual consolidation per week eliminated

Milestone

12

KPIs in one cockpit for the entire site network

reporting logic, data model and executive cockpit

Construction & procurement

Program steeringSource-to-Pay Transformation

Group-wide procurement system: bundling potential across more than €450m of spend

Construction group · program in several phases

Starting point

More than 80 companies order individually instead of as a group

  • Buying power unused: Each company negotiates on its own, the same items at different prices
  • Manual ordering: Phone, fax and email, most documents checked by hand

Solution

Platform selected, integrated into the IT landscape and embedded in the group companies

  • Selection: Criteria catalog and an interface test with real data before the contract was signed
  • Integration: ERP interfaces and master data aligned with group IT
  • Enablement: Rollout in waves, key users as multipliers, training and supplier onboarding
  • Project management office (PMO)
  • Program planning and steering
  • Data integration
  • Change management
  • Training and enablement

Result

Pilot started on plan, supplier base for regular demand integrated in the system

  • System decision: Suitable platform chosen together with all stakeholders, contract negotiated with experts
  • Pilot on plan: First companies live on schedule, first orders placed successfully through the system
  • Broad involvement: Group functions, business units and operating units involved from the start, with high acceptance

Milestone

Pilot on plan

first companies live on schedule, first orders placed through the system

more than 80 group companies · over €450m of spend

Procurement analyticsProcurement Transparency

Item-level price deviations uncovered in a construction company’s invoices

Construction group with several companies · analysis based on invoices

Starting point

Same items, different prices, no transparency

  • Scattered data: Invoices only as PDF, stored in separate systems at each company
  • Prices rose unnoticed: Item-level increases went unchallenged for months

Solution

AI reads invoices down to item level and compares across all companies

  • Data foundation: PDF invoices of all companies made usable, without touching existing systems
  • AI extraction: About 150,000 invoices from 160 suppliers captured in structured form and checked
  • Analysis: Prices and terms compared per supplier, negotiation levers prioritized
  • AI document processing
  • Data integration
  • Data quality and governance
  • KPI systems and dashboards

Result

Price transparency across all companies, without extra work for the business

  • Savings per supplier: Up to €50k per year
  • Consistent terms: 1 to 2% savings from consistent discounts
  • Lever per supplier: Prioritized by volume and deviation, ready to negotiate

View procurement analysis for construction

Realized

Up to €50k

savings per supplier and year

approx. 150,000 invoices · 160 suppliers

Anonymized client example.

Back office & finance

Data-driven decisionsLiquidity Steering

A cash flow forecast that shows how much each assumption matters

Starting point
The forecast relied on broad assumptions and little data analysis.

Qualitative result

ERP-connected

forecast model built on finance data and assumptions

scenarios and driver analysis for finance

  • Scenarios make the effect of assumptions transparent
  • Finance data and assumptions combined in one consistent model
Preview of the interactive report: A cash flow forecast that shows how much each assumption matters

Interactive Power BI report Values for illustration

Open the report in full size

AI-supported workflowsAccounting

AI booking agent: documents coded, booked and handed over automatically every day

Group with several companies · accounting and DATEV handover to the tax advisors

Starting point

A flood of documents, manual coding, correction loops with the tax advisors

  • Manual: Every document coded one by one, payments matched by hand
  • Error-prone: Special cases such as reverse charge, entertainment expenses or foreign currency

Solution

The AI agent books daily, fixed rules safeguard the tax logic

  • Automation: Read documents, code them, match them with bank transactions and book them
  • Booking rules: Tax booking rules fixed in the system, uncertain cases go to review
  • Learning loop: Every correction by the tax advisors becomes a rule and a test case for quality assurance
  • AI agents
  • AI document processing
  • Process automation
  • Data quality and governance

Result

Accounting runs automatically every day, the tax advisors review instead of booking

  • Match: About 91% of bookings identical to the tax advisors’ final version
  • Volume: About 4,500 logged AI decisions on more than 850 documents
  • Multi-entity: Each company with its own rules, data strictly separated

Realized

About 91%

of bookings identical to the tax advisors’ final version

Accounting and DATEV handover · several companies

Running in production, with the same rule-and-exception check logic we build for clients.

Other industries

Data-driven decisionsSales Steering

Sales steering on the existing CRM

Starting point
The existing CRM offered very limited analysis and access; reporting ran through manual Excel work.

Qualitative result

No system change

sales KPIs straight from the existing CRM

steering view for sales, including mobile access

  • Less manual Excel analysis
  • One shared view of the numbers in day-to-day sales

Data-driven decisionsClinical Trials

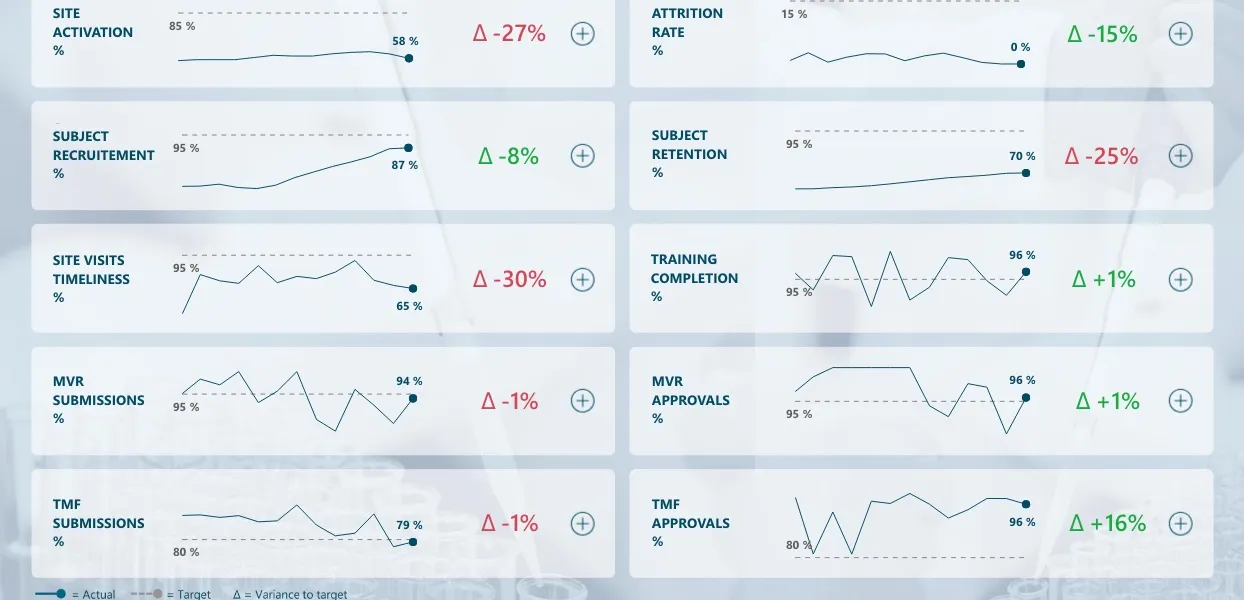
Clinical trial KPIs in self-service instead of manual consolidation

Starting point
Consolidating and analyzing data from ongoing clinical trials required heavy manual effort.

Qualitative result

Self-service

transparency on key clinical trial metrics

automated consolidation of operational trial data

  • Less manual consolidation
Preview of the interactive report: Clinical trial KPIs in self-service instead of manual consolidation

Interactive Power BI report anonymized

Open the report in full size

Our product: Governed AI Analyst for Power BI

Ask your Power BI, get answers from approved KPIs.

Alongside client projects, the DataClue team builds a product of its own. The Governed AI Analyst answers questions about your existing Power BI. It uses only the measures, definitions and access rights you have already approved. For every answer you see where the figure comes from.

  • Questions in plain languageAsked the way your leadership asks.
  • Root causes, not totalsDrill down from the anomaly to the driver.
  • Only your approved measuresAnswers built on the measures, definitions and access rights you already have.
  • Calculated, not guessedEvery figure is calculated from your data. The AI does not estimate values.
  • Your own analysesWithout waiting for an analyst to be free.
  • Management briefing with checked figuresEvery figure in the summary is checked against the data before it is shown.

The AI words the answer. The figures come from your approved measures.

Which of these cases resembles your situation?

In the initial call we show you what a comparable project would look like for you, with a target and a stop criterion.

Request an initial call